Person
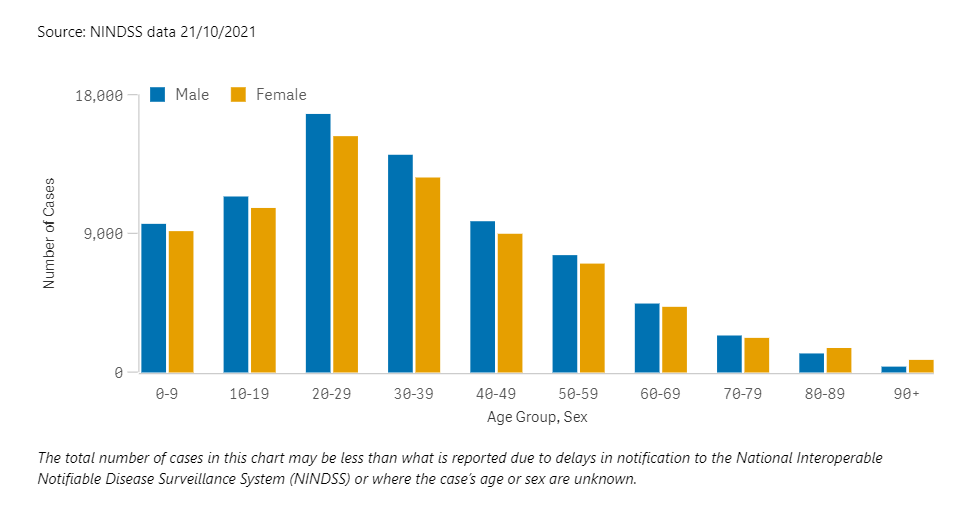
he graph below illustrates the distribution of cases by age group and
sex for COVID 19 outbreak in Australia, and shows the number of COVID-19 cases for males and
females by age group since the first confirmed cases were reported in late January 2020.The
horizontal axis shows the age breakdown in 10-year
intervals from zero years old to greater than 90 years old. The vertical axis shows the number of COVID-19 cases.
Based on the graph, how would you describe the cases in terms of age and gender?