Time
To characterize the outbreak in terms of 'time', an epidemic curve is typically drawn.
An epidemic curve is a graph that shows the number of new cases relative to the time that the illness began (this
information can be obtained by interviewing cases, or proxies (e.g. relatives) if the case is no longer alive).
This provides information about the type of epidemic, for example, whether everyone who became ill was infected by
the same source (e.g., eating a particular contaminated food),
or whether there appears to be person-to-person spread. The curve can also be used to distinguish cases that have died.
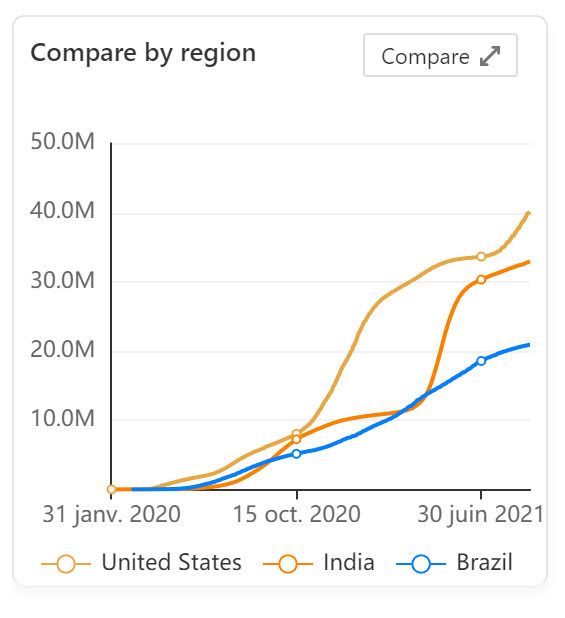
The following graph provides an example of an epidemic curve for the COVID 19 globally.

This timeline of the COVID-19 pandemic lists the chronology and epidemiology of SARS-CoV-2, the Virus responsible for the COVID-19 pandemic.
The first human cases of COVID-19 were identified in Wuhan, China, in December 2019. The World Health Organization declared the COVID-19 outbreak a Public Health Emergency of International Concern on January 30 2020, and a pandemic on March 11 2020.

Based on the epidemic curve, select which of the following statements are true by clicking on the true or false button: